
What decides whether a utility-scale solar project gets built? It is never just the sun, as projects more often stall on grid queues, planning risk, land encumbrances, and local opposition, and those tend to surface after weeks of research and spend.
Today Othersphere site assessments are generally available for utility-scale solar PV. Each one delivers detailed, fully cited diligence on a location you choose, in three days or less.
We released site assessments for data centers earlier this year, and teams have since used them across North America, Europe, Asia, and Oceania. Solar PV is the first expansion of that coverage.
The method is the same. Our platform indexes more than 60 datasets to over 180 million locations. An AI research system then investigates the local detail that global data cannot hold, reviewing thousands of documents, webpages, and videos. Our team reviews the result before delivery.
Assessments typically run 100-150 pages. Each one has four parts:
An optional module adds asset-level financial analysis, using our models or yours.
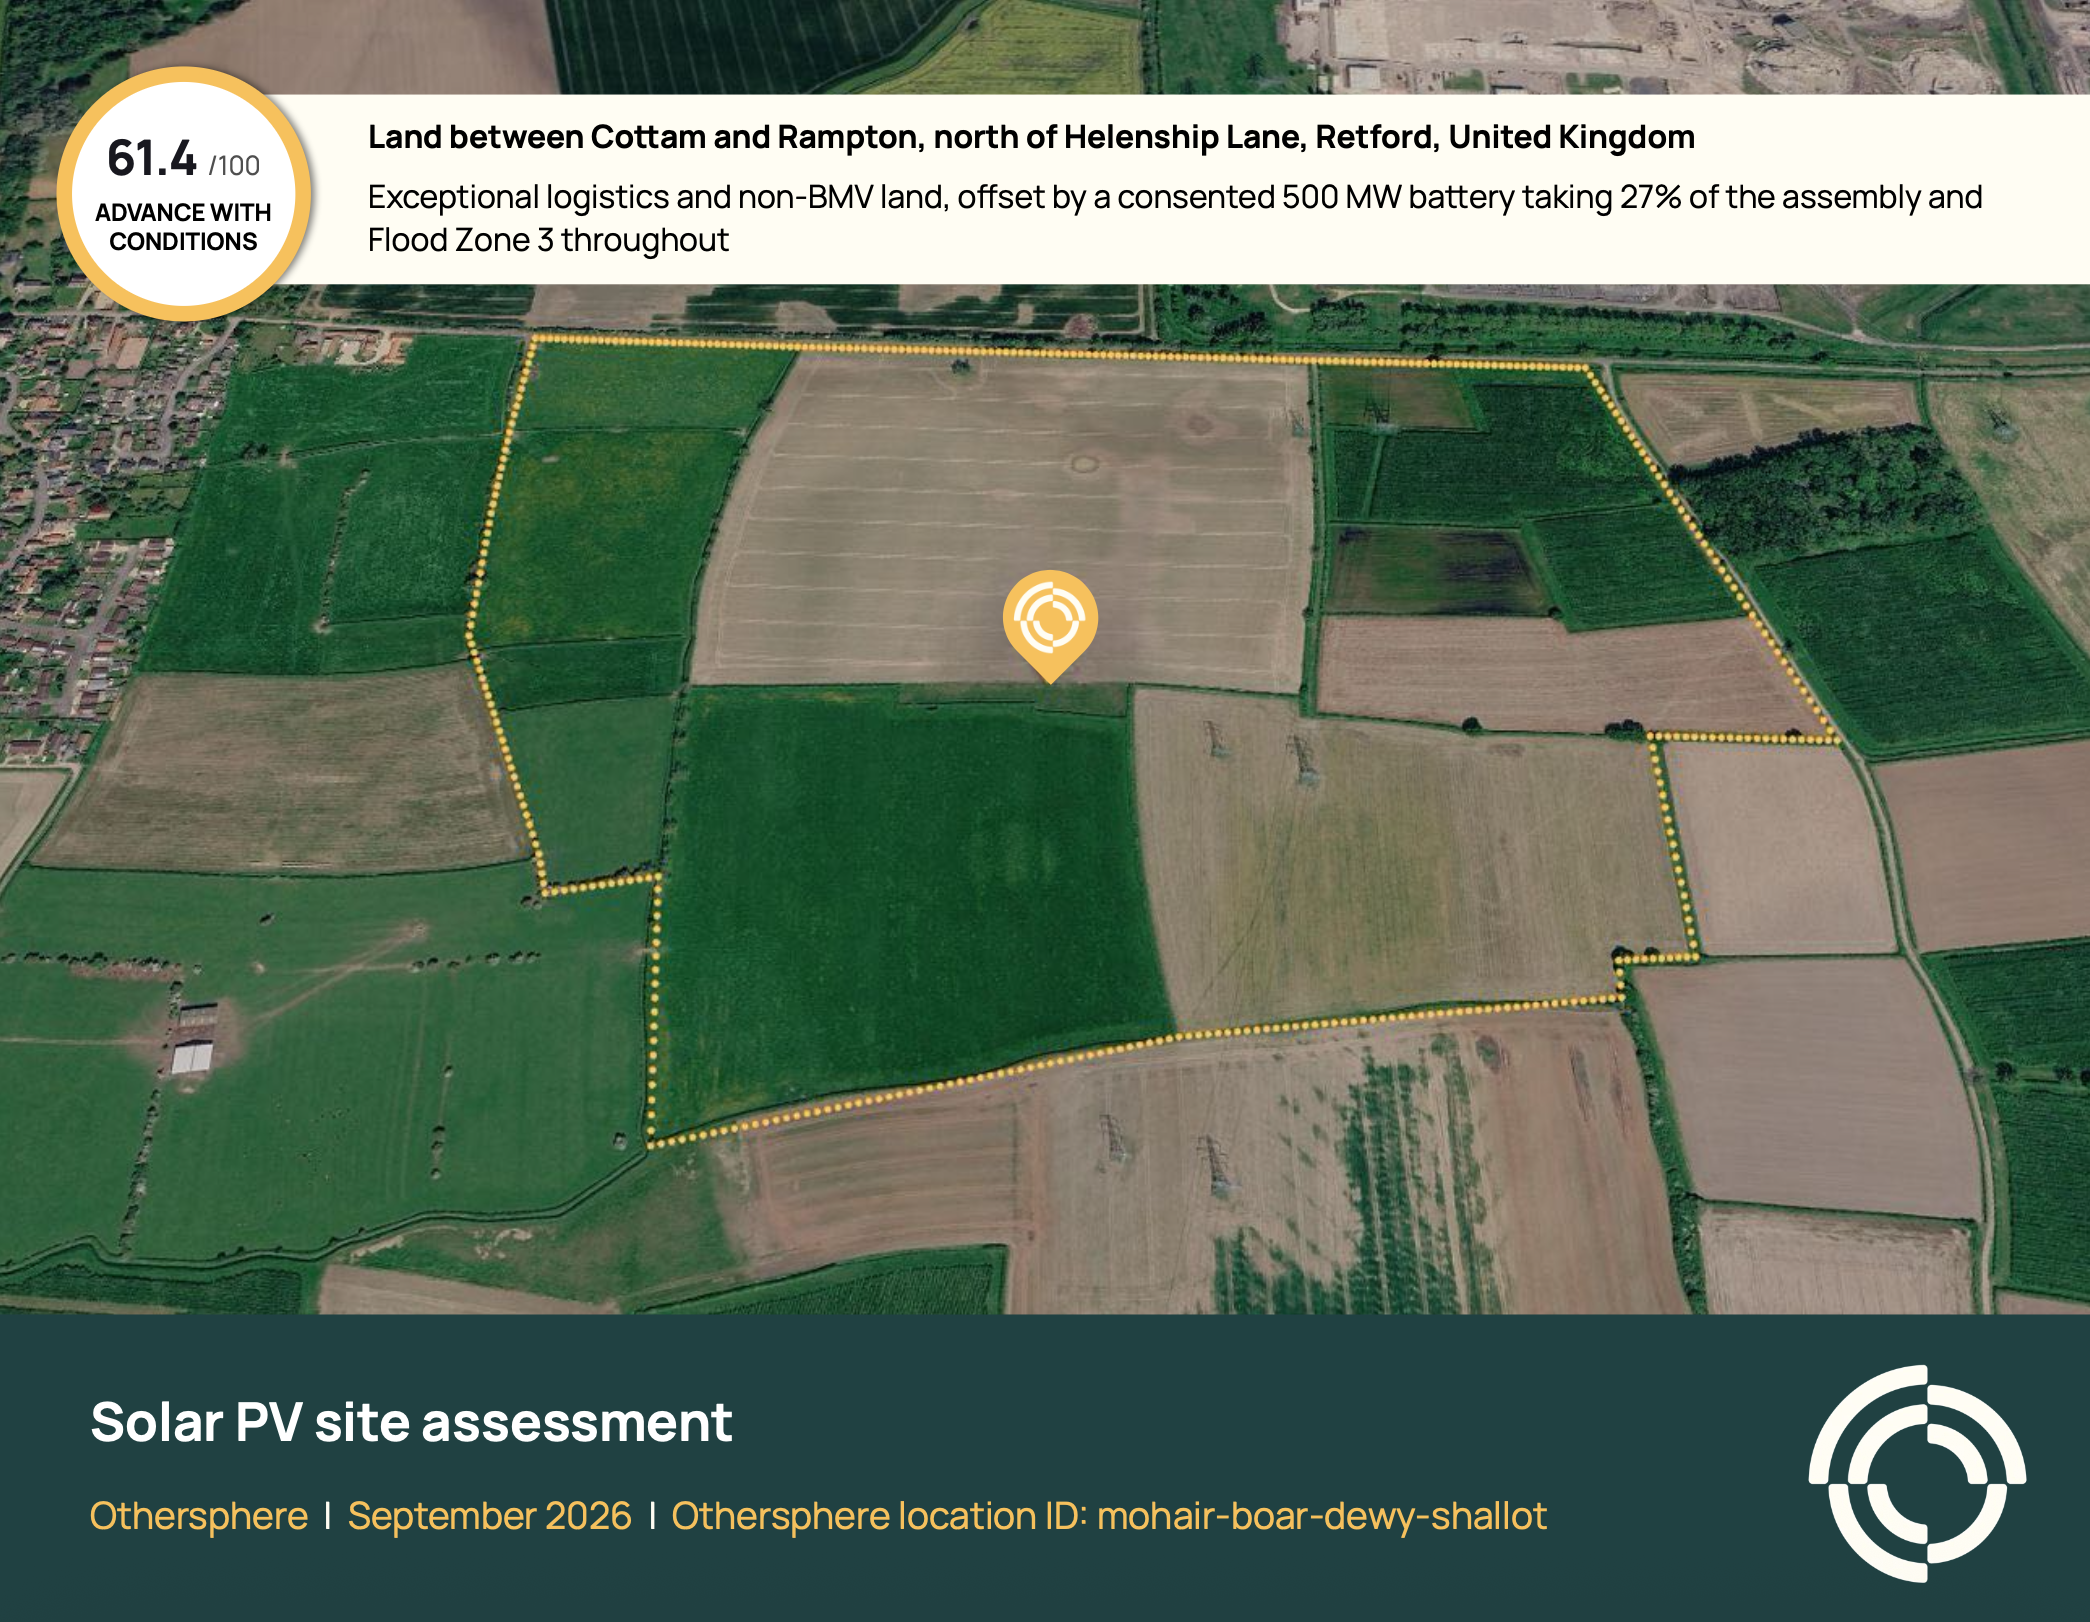
This sample assessment covers roughly 27 MWp of solar on farmland near Retford in the United Kingdom. It scores 61.4 out of 100, with a recommendation to advance with conditions, across 143 pages and 477 cited sources.
The solar resource is viable and the logistics are exceptional. The findings that decide the project sit elsewhere:
The assessment closes with four specific actions to take before committing more capital, from a grid connection application to a topographical survey.
Slow diligence limits pipeline quality, because a team can only look closely at a few sites. With a full assessment in days, developers can vet more locations and drop the weak ones before paying for options, surveys, or consultants.
For operators and financiers, the same report gives a cited view of project fundamentals before capital is committed. Across our assessments, teams reach decisions in 95% less time.
An assessment does not replace surveys, title searches, or professional advice. It tells you which of them to commission first, and which sites do not merit the expense.
The quickest way in is Scout. Select utility-scale solar PV, screen your location, and request a full assessment from within the app. A request is not an order; we follow up to confirm the location and asset configuration first.
You can also reach us directly at explore@othersphere.io.
Onshore wind and BESS are next in line for both Scout and our site assessments. If there is an asset type you need sooner, please tell us.
Source:
Original data source:
Spatial coverage:
Visibility:
Methodology:
Download:
License:
The data provided herein is made available on an "as-is" basis, without warranty of any kind, either expressed or implied. The provider does not guarantee the accuracy, completeness, or usefulness of the information. By downloading this data, the user acknowledges that the provider shall not be held liable for any errors, inaccuracies, or omissions in the data, nor for any damages, losses, or consequences arising from the use, misuse, or reliance on this data. The user assumes full responsibility for the use of the information provided and agrees to use it with caution and at their own risk.
How long should it take to learn whether a site deserves a second look?
For most infrastructure teams the answer is still weeks. Research is scattered and manual, and the first red flag often appears after real money has been spent.
Today we are releasing the beta of Scout, at scout.othersphere.io, a public app to screen infrastructure sites anywhere in the world. Choose an asset type, choose a location, and instantly see an initial screen of its viability.
Othersphere exists to optimize the deployment of high-performance infrastructure worldwide. Our platform indexes more than 60 datasets to over 180 million locations, and models each one from the bottom up.
Until now, that work has mostly reached people through our Explorer software and our full site assessments. Scout opens a narrow view of the same derived data to anyone who wants to look.
Scout has three steps:
The beta launches with two asset types: data centers and utility-scale solar PV.
Scores are for a generalized version of each asset type. Project details, such as the size of a solar facility or the power supply goals of a data center, would shift how factors are weighted.
Weighting is a judgment, not a measurement, and different stakeholders will weigh the same factors differently. A few constraints are severe enough to be deal-breakers, which set the overall score to zero.
Scout shows topic scores and not the underlying values, because much of the data behind them is licensed. The FAQ in the app explains how the score is built.
Scout is deliberately light. It scores dozens of data topics indexed to each ~0.7 km² tile, which is enough to decide where to look harder. A full site assessment is where that harder look happens.
A full assessment adds factors the global screen leaves out entirely, such as community sentiment and permitting, along with detail on labor availability, zoning, and incentive programs. It works at the level of the individual property, confirms and refines the screening data with hyperlocal research, and ends with comprehensive scoring and a go/no-go recommendation.
Assessments typically run 100-150 pages of fully cited analysis and arrive in three days or less. They are available today for data centers and now utility-scale solar PV.
In the months ahead we will keep adding asset types to both Scout and our site assessments. Onshore wind and BESS are next in line based on feedback so far, and we want to hear which assets matter to you.
So please explore the globe and share it as you see fit. Scout is in beta ahead of its formal launch, and your comments will shape what we add.
If you need detailed diligence at a location you choose, request it through the app or reach us at explore@othersphere.io.
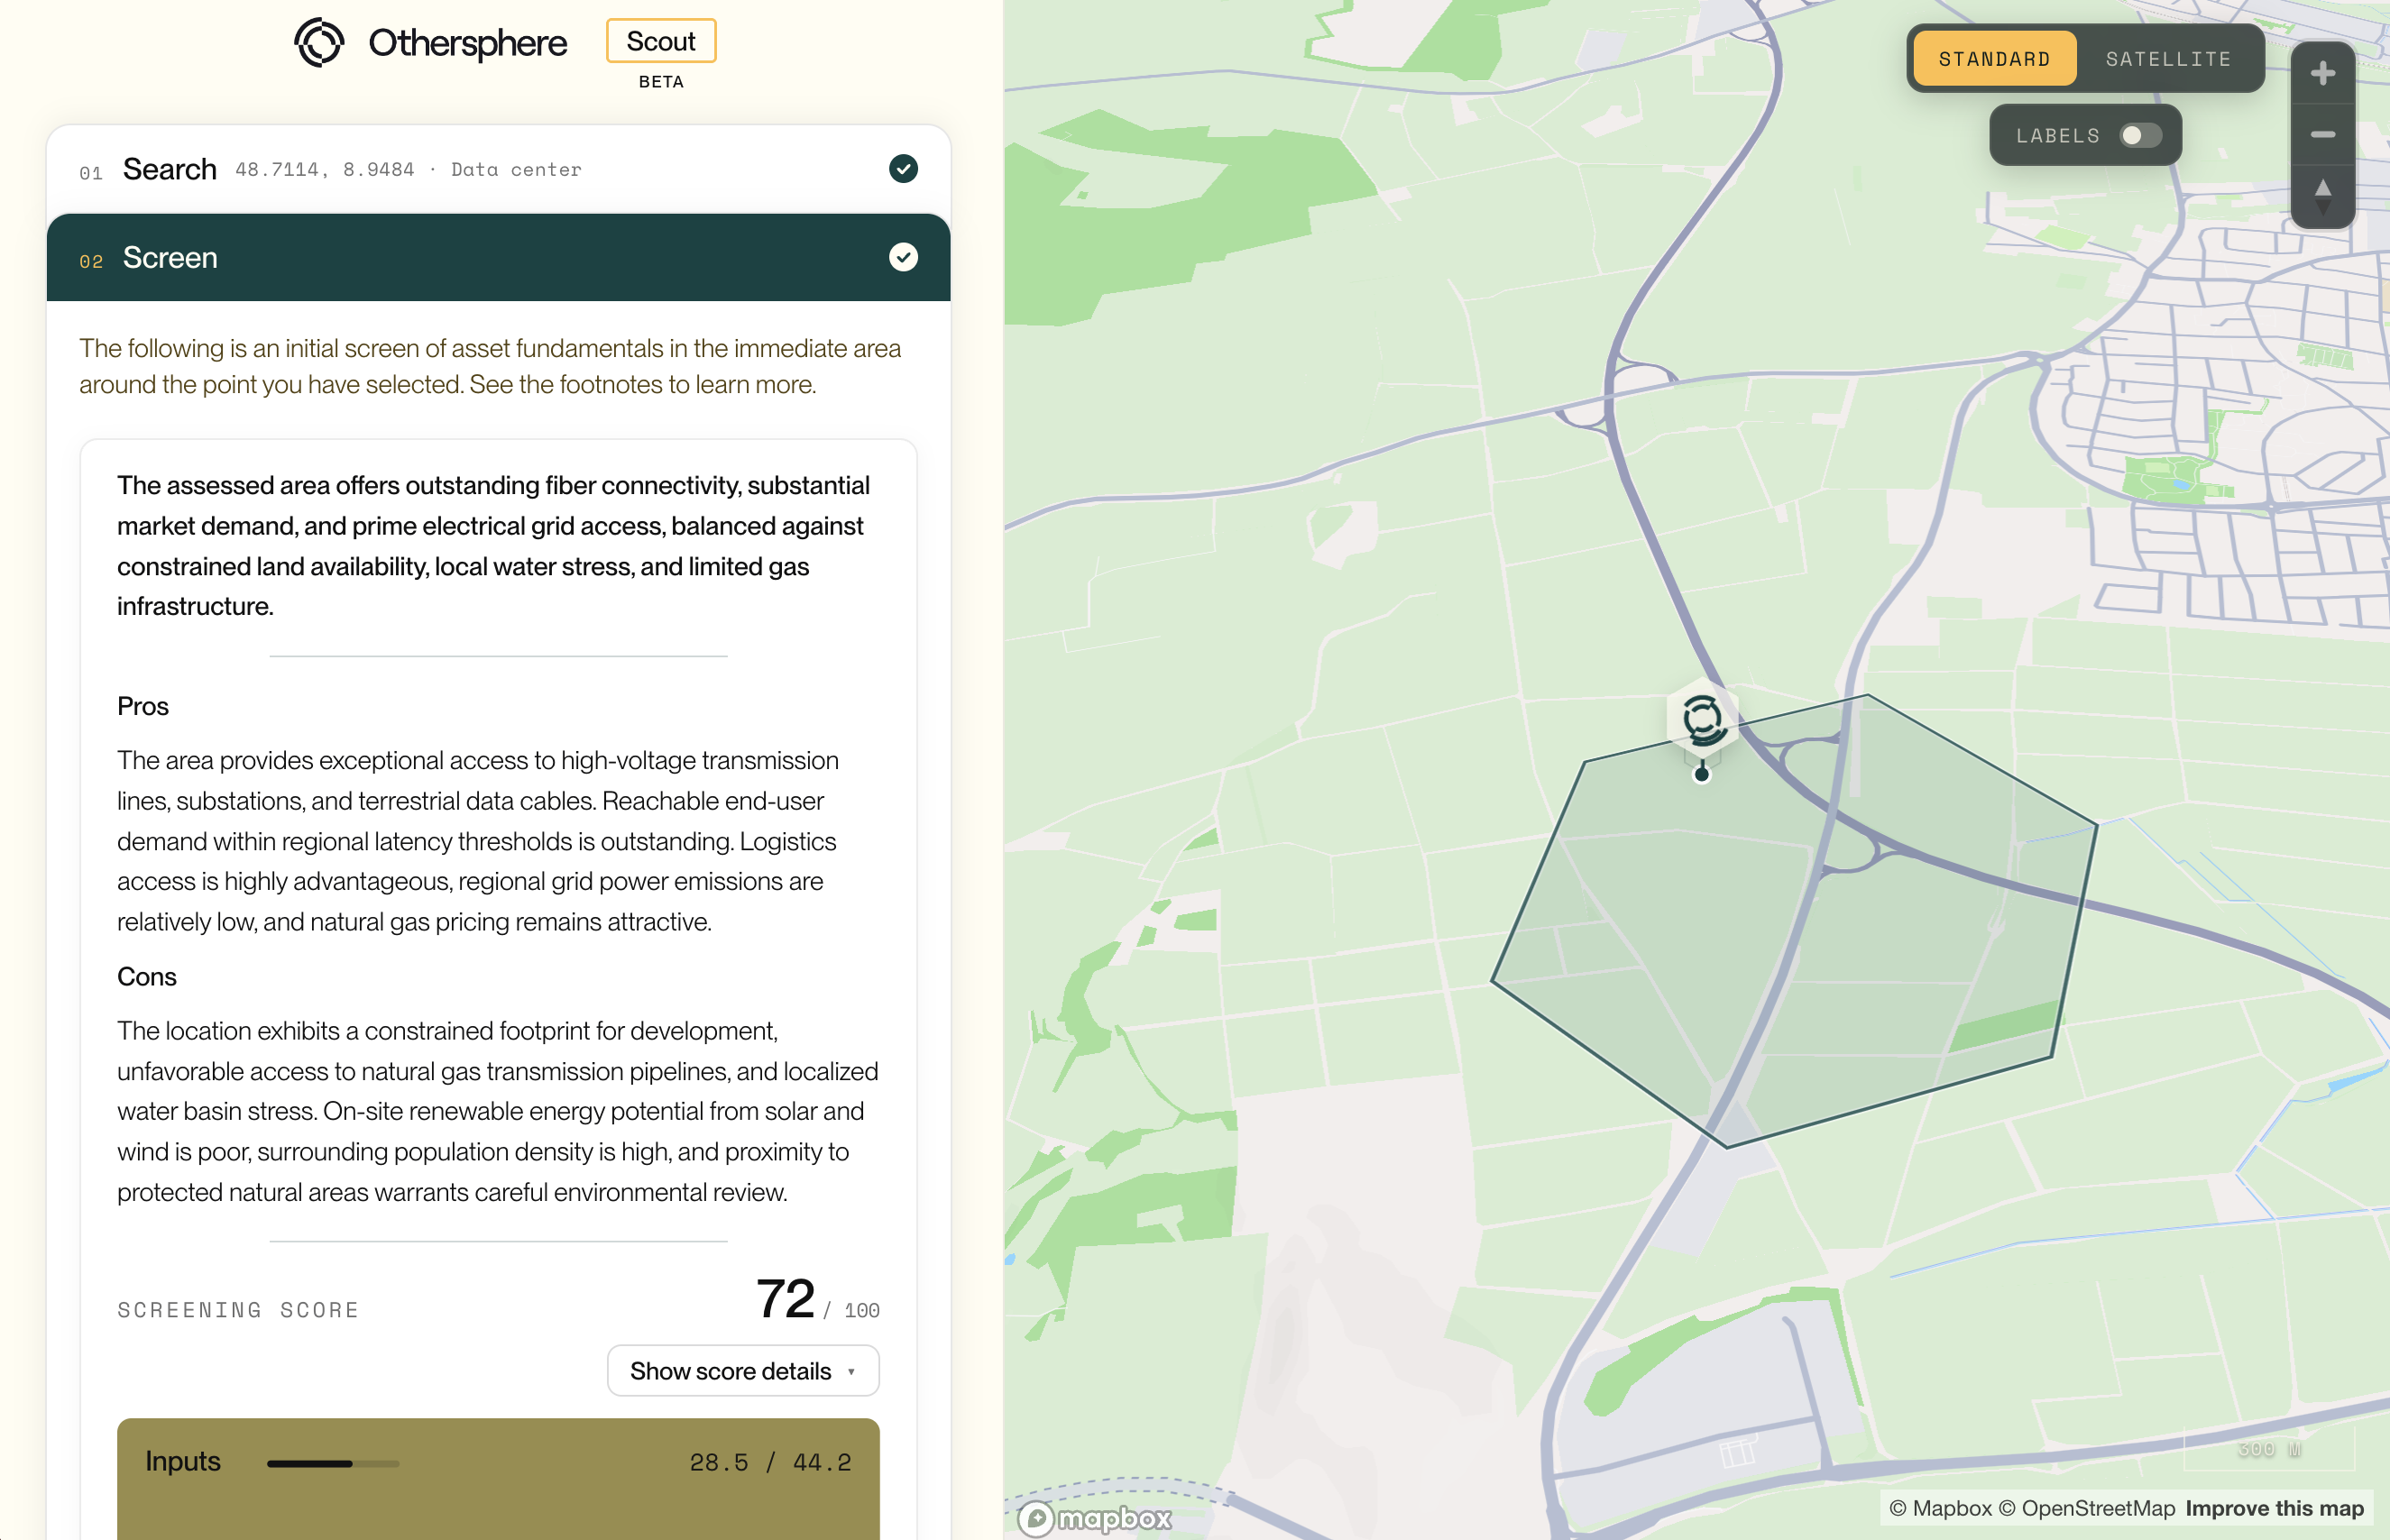
How long should it take to learn whether a site deserves a second look? For most infrastructure teams the answer is still weeks. Research is scattered and manual, and the first red flag often appears after real money has been spent. Today we are releasing the beta of Scout, a public app to instantly screen infrastructure sites anywhere in the world.

When assessing data center sites, there can be a balancing act between remote locations and those closer to population centers.
Remote locations can offer clear advantages, including more building space or possibly lower-cost energy. But for AI inference, colocation, and other traditional compute needs, being closer to population centers of end-users is critical.
For data centers, fiber infrastructure plays a central role in that equation. Though factors like access to energy, community sentiment, and the permitting environment are a critical part of site assessments,this infrastructure is only as valuable as the user base it can reach.
To support this decision-making, we recently added a new data layer to inform Othersphere’s data center diligence engine, and we’re excited to share more about this work (to say nothing of the pretty maps).
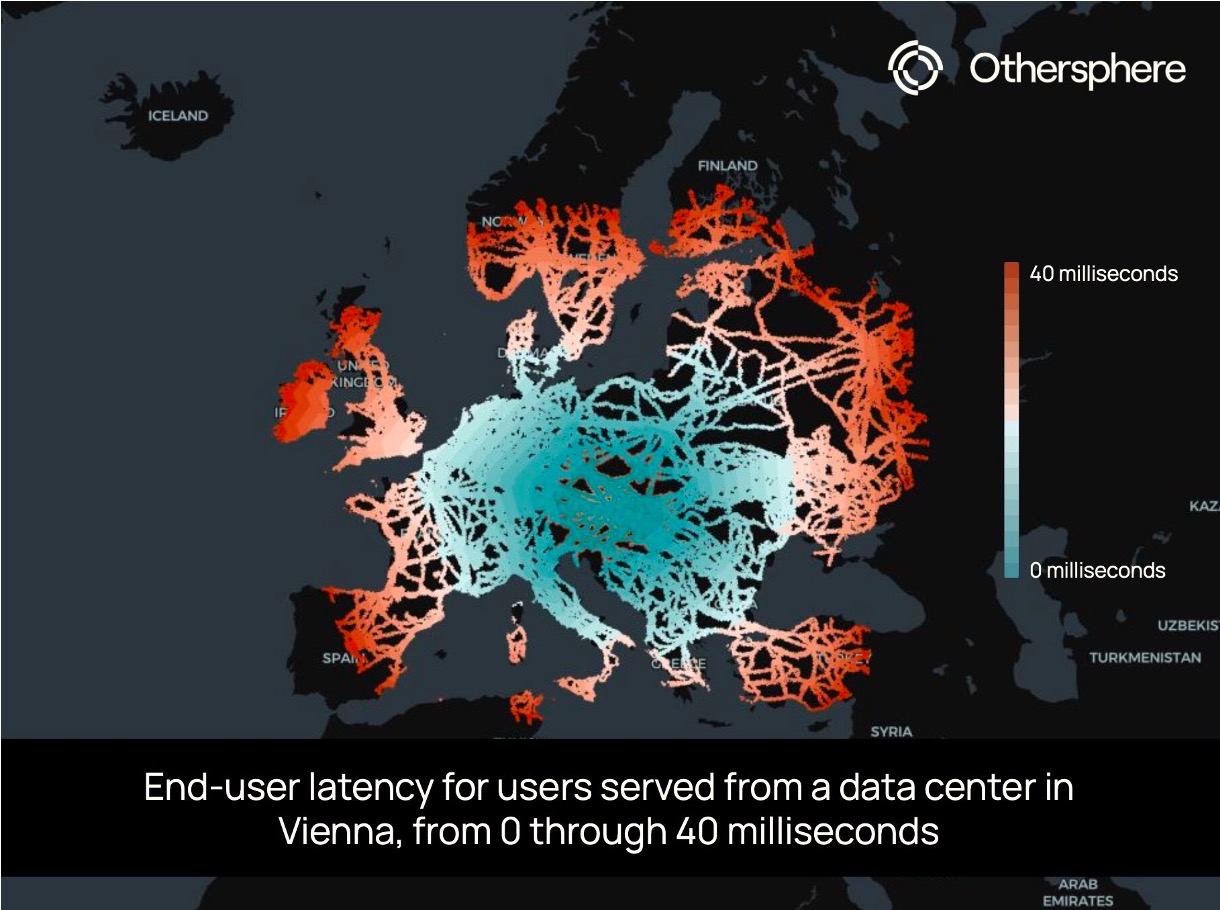
This new data layer provides an estimate of the population that can be reached from any location within certain latency thresholds. It adds an important dimension to site selection by helping clarify the tradeoffs between locations that may look attractive for different reasons.
This is made possible through our infrastructure analysis methodology, which indexes critical data to millions of locations and models the relationships within and between them. For this population estimate, the calculation begins by overlaying the world’s terrestrial and submarine fiber cable infrastructure on high-resolution population data. We then construct a weighted graph covering the entire globe, where adjacent tiles are connected by edges to calculate round-trip latency. As the signal moves from any user-selected location across on-fiber or off-fiber tiles, varying time penalties are applied. At a global scale, this requires simplifying assumptions on key questions such as available capacity, which we are able to investigate more deeply in each site-specific assessment.
This bottom-up estimate reveals stark geographic disparities. A well-connected tile in Europe (a randomly selected address in Vienna, in this case) can reach hundreds of millions of people within 40 ms, while a tile not far away in a telecom gap may only provide low-latency services to its immediate neighbors.
This data layer powers Othersphere’s understanding of where digital infrastructure creates (or fails to create) meaningful connectivity, and it is now threaded into all of our site assessments and scoring.
Reach out if you would like to learn more, or comment below if there are locations you’d like to see us post about.
When assessing data center sites, there can be a balancing act between remote locations and those closer to population centers.
Please reach out if you would like to learn more about Othersphere, our products, and opportunities to partner in accelerating deployment of high performance, sustainable infrastructure.


